How we built a low-cost data warehouse
Here at CompareEuropeGroup we faced a common issue most startups (and even larger companies…) face: accessing your own data. Currently CompareEuropeGroup has ventures in Denmark (Samlino.dk), Finland (VertaaEnsin.fi), Belgium (TopCompare.be) and Portugal (ComparaJá.pt), all of them producing tons of data everyday that should be within reach for management reporting, data analysis and ultimately business decision-making. But data was hard-to-get, scattered across databases and not easily linkable across platforms.
A Business Intelligence team’s job is ultimately to allow and democratise (some might add “evangelise”) that access to any data. Having this in mind, we set a plan to deliver a fully usable data warehouse in 3 months. Ambitious yes, but feasible within the context of a company that is 4 years old.

CompareEuropeGroup benefits from having a reduced number of data sources, which might be common to most startups: marketing platforms (e.g., Google AdWords, Facebook, Bing), website interaction data (e.g., Google Analytics), conversion tracking systems (e.g., DoubleClick Campaign Manager), CRM systems and call-centre diallers.
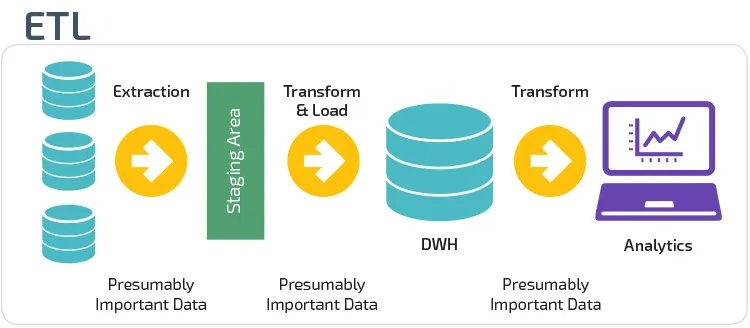
Let’s then start with the simplest concept in a data warehouse (DWH): extract, transform and load (ETL). In building a DWH, that’s pretty much what you need to account for: how are you going to extract the data, in which way do you transform it, and finally how do you load and visualize it.

Extract your data
In the old times building a DWH meant having your own on-premise database and accessing all data sources by ODBC drivers. Today you can choose any cloud/off-premise database (still keeping your data safeguarded, redundant and within privacy policies), avoiding all the internal tech hassle of building and maintaining it. Plus, ODBC connectors are long due if you’re willing to spend some bucks on 3rd-party integrators, some of which will do the integration for free.
At CompareEuropeGroup we decided to choose Google BigQuery as our DWH solution, for the following reasons: i) outstanding integration with Google products; ii) one of cheapest options in terms of processing and storage; iii) recent developments on out-of-the-shelf Machine Learning capabilities. Downsides to BigQuery (for now) are the relatively low maturity of the products (vs. Amazon Redshift, for instance) and lack of dedicated account management — but I do see some changes in the latter recently. Considering a reasonable consumption of data resources, you can keep your DWH costs under $500/month (already including data integrations).
Additionally, you need to consider the integrations. The majority of the cloud DWH solutions offer direct integrations with Google Analytics, AdWords, Facebook, etc. Specifically on BigQuery, it is a matter of hours to get the integration with Google AdWords, Google Analytics and DoubleClick Campaign Manager up and running.
When it comes to other marketing platforms (such as Bing, Facebook, Criteo, and the likes) you can leverage freemium services such as Stitch, etc. — simply search for “YYY-BigQuery integration” when in doubt. Another option is to use the super-powerful Supermetrics, dump the data into a Google Sheet and linking it to your DWH (most likely a cheaper solution, but you might run into a scalability issues when your data grows).
If you use Salesforce as your CRM system, you can also use pre-defined solutions for integration — if you don’t use Salesforce or another mainstream CRM solution, you might need to go back to ODBC connections :(
Transform the data
Transforming data is probably the toughest of the three steps. In complex environments this might mean managing workflows of hundreds of steps.
A lot of the data visualisation tools offer visual modules for data preparation, such as Tableau Prep and Alterix. They tend to be expensive and have a moderate learning curve.
Internally we decided to build our workflows inside BigQuery with SQL. This decision was highly enabled by having prior SQL experience within the team, therefore the learning curve was minimised. Even though BigQuery is still a relatively immature tool, it provides mechanisms such as Scheduled Queries to automate the workflows created in SQL. Another plus of this approach is having the Load part of ETL done right away, as the prepared tables stay within the DWH/BigQuery.
Load and Visualize the data
Hopefully you agree with me on this: now the fun part begins! After loading your data onto the DWH (which hopefully was the easiest part of you went for a cloud solution), it’s time to visualise the data and take insights from it.
Some data warehouse solutions have basic visualisation capabilities, but in modern business I would advise to go to a more advanced tool. At CompareEuropeGroup we analysed several tools and ended up deciding between Looker and Tableau: i) both have very advanced data analysis capabilities; ii) both integrate beautifully with BigQuery; iii) both have incredible online communities and learning centres.
The final decision was in favour of Tableau: at $500/year each Explorer license, the economics of scaling become much simpler, versus the high fixed price ($3000/month) that Looker charges.
Now what?
With so much data and so easily accessible, the challenge will be to know how to use to its full potential. As an organisation, I believe the next big thing will be to transform the mindset of everyone to leverage the pot of gold they have in-house.
Continuous training, frequent communication on DWH updates and senior management buy-in will be required to make use of such a powerful asset.
I will leave you with a word of encouragement on this necessary road to the success of your company. It will be different in 3 months :)